
Last updated: 8 October 2026. Every screenshot below was recorded on 5 and 8 October 2026 (the Chart analysis panel in Step 1 is from 5 October) on an IQ Option Practice account registered in Brazil, on one-minute EUR/USD candles. The candles in the two example pictures are from 4 and 5 October 2026, scrolled back on the same chart. We placed no real-money trade. The tested box reports ten one-dollar Practice orders from 2 October 2026, whose signals all came from one-minute candles, and a replay of the rule on recorded candles. It shows what the rule did on those days and says nothing about what it will do next.
The “5 minute” in this strategy’s name is the expiry, not the candle size: the chart uses one-minute candles and each option lasts five minutes. The entry needs three things on the same closed candle: a close on the right side of the 200-period EMA, the RSI on the same side of 50, and an engulfing candle in that direction. This guide shows how to set the chart on IQ Option’s current platform, how the entry works and what the rule did in our tests: 4 of 10 Practice orders won.
Quick answer
- Candles and expiry: one-minute candles and a five-minute expiry. The “5 minute” in the title is the expiry, not the candle size.
- Indicators: Moving Average, type EMA, period 200, and RSI with period 14; the 50 level is on the RSI panel’s scale.
- Higher: a bullish engulfing candle closes above the EMA 200 while the RSI is above 50.
- Lower: a bearish engulfing candle closes below the EMA 200 while the RSI is below 50.
- Our Practice test, 2 October 2026: 10 one-dollar orders on one-minute candles, 4 won and 6 lost, a net loss of $2.66. Regular pairs: 2 of 3 won. OTC pairs: 2 of 7 won.
- Replay on recorded candles: 81 signals on EUR/USD one-minute candles (4 to 5 October 2026), 5-minute expiry: 40 won, 41 lost (49.4%), below the 54.1% needed to break even at an 85% payout.
- Break-even: at an 85% payout a trade needs to win about 54.1% of the time. With 81 trades the win rate has a margin of error of about ±6 points (one standard error), so 49.4% cannot be told from break-even.
Setting up the chart
These steps use the web traderoom on a Practice balance. The numbers in each screenshot match the numbers in the text. The strategy uses two indicators. The EMA 200 is the trend filter: an exponential moving average gives more weight to recent prices, and IQ Option’s blog on moving averages describes long settings such as 100 or 200 periods as showing the major market direction. On a one-minute chart, 200 candles cover about three hours and twenty minutes, so “long term” here is long only compared with a one-minute candle. The RSI is the momentum filter: IQ Option’s blog says an RSI that holds above 50 supports positive momentum, one that holds below 50 supports negative momentum, and repeated crossings around 50 suggest mixed conditions.
Step 1: Open Chart analysis
Click the indicators button, the wave icon in the toolbar at the bottom left of the chart (1). The Chart analysis panel opens with the tabs Indicators, Templates, Widgets and Scripts. Its search box, “Search for indicators” (2), finds an indicator by name.

Step 2: Add the RSI and find the 50 level
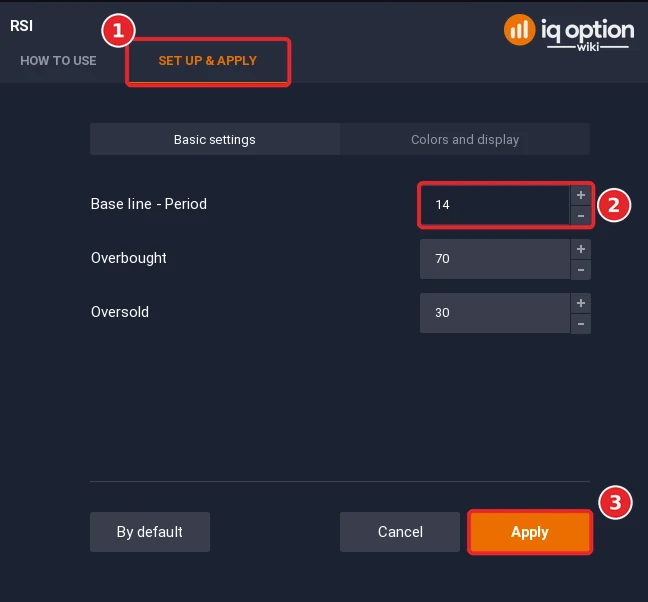
Type RSI in the search box and click Relative Strength Index (RSI) in the results. In the dialog that opens, switch from How to use to the Set up & apply tab (1), leave Period (labelled Base line – Period) at 14 (2) and click Apply (3). The RSI panel draws the support lines at 70 and 30, and its scale also shows a grid line at 50 with a 50 label, so the level the strategy reads needs no setting.
Step 3: Add the EMA 200
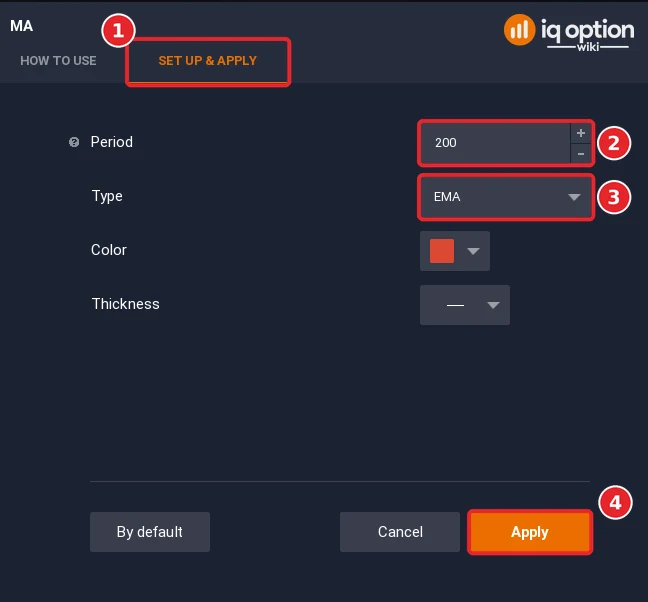
Click the indicators button again, type Moving Average in the search box and click Moving Average. IQ Option has one Moving Average indicator with a Type setting, so the EMA is chosen there. On Set up & apply (1), set Period to 200 (2) and Type to EMA (3), then click Apply (4). A line appears on the price chart.
Step 4: Use one-minute candles
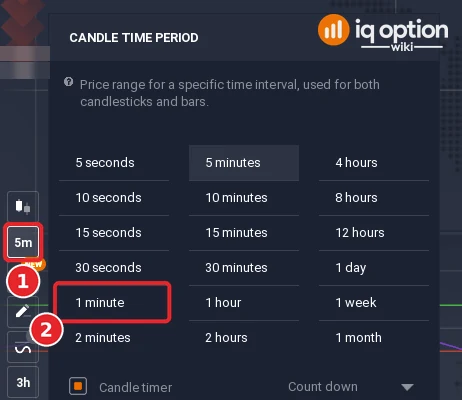
Click the candle time period button in the toolbar at the bottom left (1) and choose 1 minute (2). The chart should show Japanese candles; if it shows a line or bars, change it with the chart type button in the same toolbar (see chart types on IQ Option). The “5 minute” in the title is the expiry, and you set it in Step 7.
Step 5: Check the finished chart
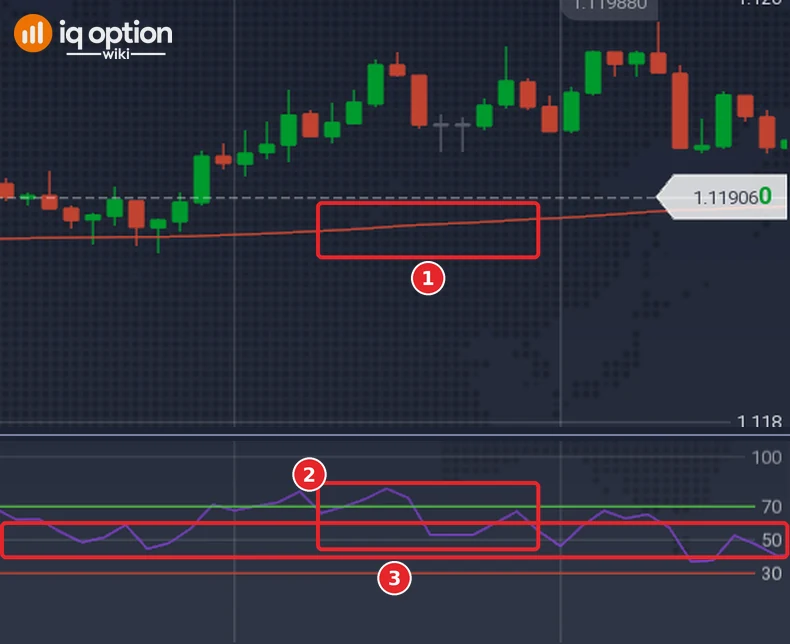
The price chart shows the EMA 200 line (1) among the candles. The RSI panel under it shows the RSI line (2) and the 50 level (3). The rule compares the close of the engulfing candle with the EMA 200 line (1) and the RSI (2) with the 50 level (3).
Step 6: Save the template
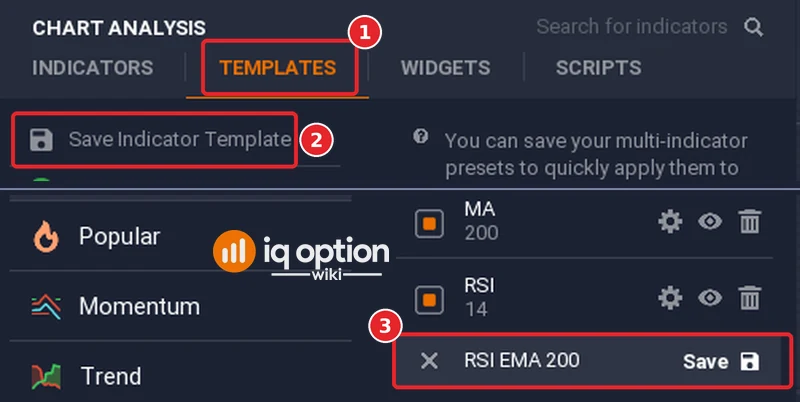
To keep both indicators together, click the indicators button again and open the Templates tab (1) and click Save Indicator Template (2). The Added list opens with a Name field (3): type a name, for example RSI EMA 200, and click Save. Next time, open the same tab and click the template to load both indicators at once. For chart templates in general, see IQ Option chart templates.
Step 7: Set the five-minute expiry
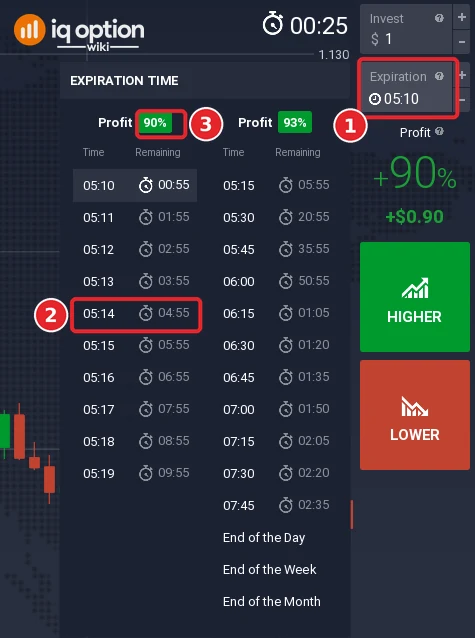
Before you open an order, look at the Expiration field of the trade panel (1). It shows a clock time, not a number of minutes. Click it to open the Expiration time list (2), which gives each possible time with the time remaining next to it. Choose the time five minutes after the moment the engulfing candle closes: in the picture the platform clock reads 05:09, and 05:14 (2) has 04:55 remaining. The payout percentage (3) is shown at the top of each column of the list before you buy (Profit 90% over the minute steps and 93% over the quarter-hour marks on 8 October 2026; the orders of our 2 October test paid 85% and 82%); it changes by asset and over time, so read it each time. On the chart, according to IQ Option’s Help, the time of purchase is a white dotted line and the expiration time a solid red line; when the trade crosses the red line it closes and you make a profit or a loss. See expiry times on IQ Option for the other expiry choices.
Reading 5 minute binary options signals with the RSI + EMA + engulfing pattern strategy
The “signals” in this strategy are conditions that you check on your own chart; nothing is sent to you. An engulfing pattern forms when one candle fully covers the body of the previous candle, and the previous candle has the opposite colour. IQ Option’s blog says a bullish engulfing pattern shows strong buying pressure and a bearish one strong selling pressure, and that such patterns often appear at key levels. The strategy reads the bodies only and ignores the shadows. The test reads the rule like this:
| Part of the rule | Higher | Lower |
|---|---|---|
| Trend filter | The engulfing candle closes above the EMA 200 | The engulfing candle closes below the EMA 200 |
| Momentum | RSI (14) above 50 on that candle | RSI (14) below 50 on that candle |
| Trigger | Bullish engulfing candle: a green body that covers the body of the previous red candle | Bearish engulfing candle: a red body that covers the body of the previous green candle |
| Order | Higher option, five-minute expiry, opened when the engulfing candle closes | Lower option, five-minute expiry, opened when the engulfing candle closes |
5 minute binary options signals for short positions
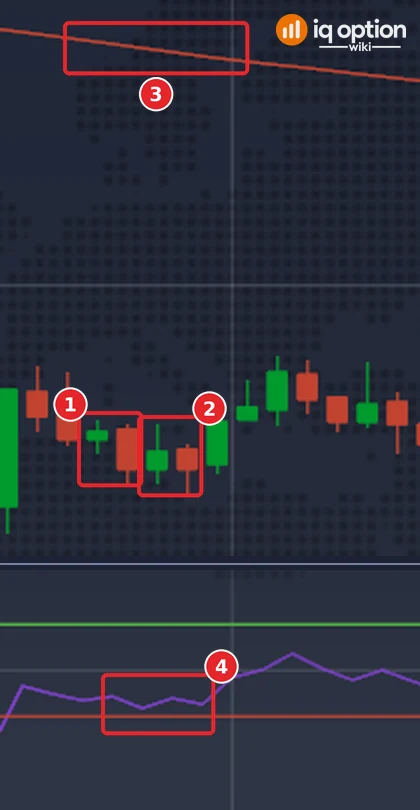
Look at the EMA 200 line first: the engulfing candle must close below it. Then look at the RSI panel: the RSI must be below 50. With both conditions met, wait for a bearish engulfing candle, a red candle whose body covers the body of the previous green candle. When it closes, open a Lower option with a five-minute expiry.
The first Lower signal of the replay came on the evening of Sunday 4 October 2026 at 21:26 on the platform clock (00:26 UTC on 5 October); the replay counts signals only from the 200th candle of a run, so it is the first one it found. A red candle opened at 1.12471 and closed at 1.12463, covering the body of the green candle before it (1.12469 to 1.124705). Its close was far below the EMA 200 line, which read about 1.1255 on the chart, and the RSI was below 50 (33.6 in the replay). A Lower option opened at that close, at 1.12463, and expiring five minutes later ended at 1.124825, above the entry price: it lost. Two minutes later, at 21:28, the rule fired again with the same entry price, and that option ended at 1.124725: a second loss.
5 minute binary options signals for long positions
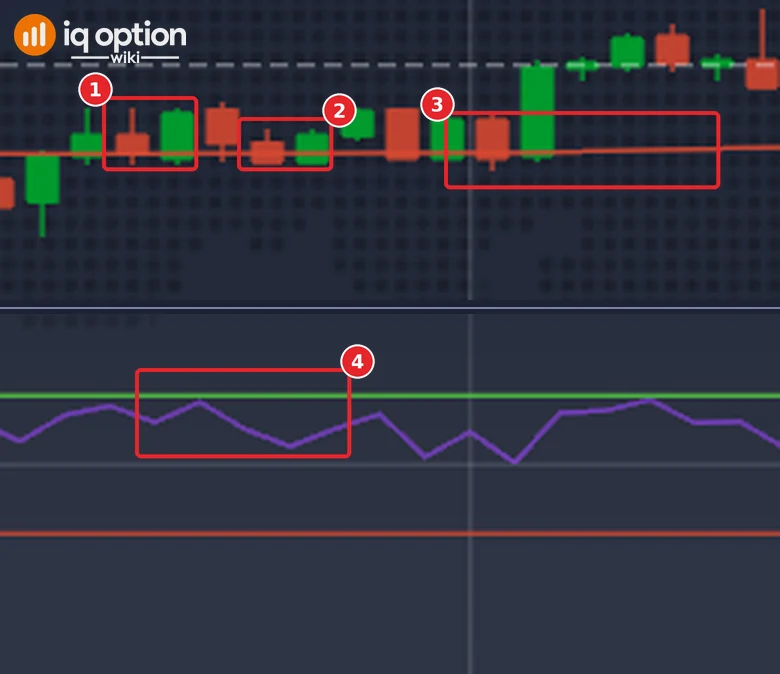
For a long position the engulfing candle must close above the EMA 200 and the RSI must be above 50. Then wait for a bullish engulfing candle, a green candle whose body covers the body of the previous red candle. When it closes, open a Higher option with a five-minute expiry.
The first Higher signal of the replay came on Monday 5 October 2026 at 02:38 on the platform clock (05:38 UTC). The candle before it was red (1.118895 to 1.118855). The signal candle opened at 1.118845 and closed at 1.118945, so its body covered the previous one. The close was above the EMA 200 (about 1.11886) and the RSI was 68, above 50, so all three conditions held. A Higher option opened at that close, at 1.118945, and expiring five minutes later ended at 1.118845: it lost. Three minutes later, at 02:41, the conditions held again (a green candle covering a red one, a close of 1.118895 above the EMA, RSI 60.5), and that option ended at 1.11905: it won. We placed no order: the entry and exit prices come from the recorded candles.
Tested on IQ Option: 2 October 2026 (Practice orders) and 8 October 2026 (replay)
| Asset and candles | Practice orders: ten one-dollar orders on a Practice balance, one at a time: 3 on regular pairs (GBP/USD, USD/JPY and EUR/JPY) and 7 on OTC pairs (EUR/USD, USD/CHF, GBP/JPY, GBP/USD twice, EUR/JPY and NZD/USD). One-minute candles, not five-minute candles; the five minutes are the expiry. The search for each order’s signal started between 18:05 and 20:24 UTC on Friday 2 October 2026. Replay: EUR/USD (binary, regular market, not OTC), one-minute candles recorded from IQ Option’s Practice traderoom: a run of 1,348 candles from Sunday 4 October 2026 21:01 to Monday 5 October 19:29 UTC. The first 200 candles only feed the EMA(200), so signals start on Monday 5 October at 00:21 UTC. A 157-candle run on Friday 2 October (18:23 to 21:00 UTC) was too short for the EMA and is not used. The replay uses recorded candles and placed no real orders. |
|---|---|
| Rule tested | On one-minute candles, a bullish engulfing candle (a green body that covers the body of the previous red candle) that closes above the EMA 200 while the RSI (period 14) is above 50 opens a Higher option. A bearish engulfing candle (a red body that covers the body of the previous green candle) that closes below the EMA 200 while the RSI is below 50 opens a Lower option. Each option has a five-minute expiry and opens when the engulfing candle closes. |
| Signals | Practice orders: 10, of which 3 Higher and 7 Lower. Replay: 81 (33 Higher, 48 Lower). Some follow each other within minutes, so they are not independent trades. |
| Outcomes | Practice orders: 4 won, 6 lost, none refunded; a net loss of $2.66 on $10 staked. Regular pairs: 2 of 3 won. OTC pairs: 2 of 7 won. Higher: 1 of 3 won. Lower: 3 of 7 won. The wins paid 85% on regular pairs and 82% on OTC pairs. Replay: 40 won, 41 lost, none refunded: 49.4% of decided trades (Higher 15 of 33, Lower 25 of 48), a net loss of $7.00 on $81 staked at an 85% payout. Break-even is 54.1%, so the rule was below it on these candles. The RSI is smoothed with an exponential average and the EMA(200) is seeded with the average of the first 200 closes, as the platform’s indicators do. |
| Break-even | At an 85% payout a trade needs to win more than 54% of the time to break even (1 ÷ 1.85); at 82%, about 55% (1 ÷ 1.82). Four wins in ten orders is 40%. |
Seven of the ten orders were on OTC pairs. An OTC asset is traded outside the regular market: according to IQ Option’s Terms its price is formed from data on the trade requests and orders of its clients, and IQ Option’s Help says the quotes are generated on the broker’s server. The engulfing candles on those charts therefore come from IQ Option’s own quotes, not from the market. Ten orders placed over just over two hours of one Friday evening (UTC) say nothing about how the rule will behave in other hours or weeks, on regular pairs or on OTC pairs, and IQ Option’s own blog says most strategies need dozens, and often hundreds, of trades before the results mean anything. The replay is a look back at candles recorded from IQ Option’s Practice traderoom on 4 and 5 October 2026, placed no real orders and is not a forecast. A short test proves nothing about the future, and no profit and no win rate is promised here.
Pros and Cons
| Pros | Cons |
|---|---|
| All three conditions can be seen on the chart: a close beyond the EMA 200, the side of 50 on the RSI and an engulfing candle. | Engulfing candles are rare, so marks are sparse, and on quiet charts they can be tiny. |
| The rule can be written down and run on a Practice balance at no cost. | In sideways markets price often stays close to a long EMA, where the side of the EMA says little. |
| One setup serves both directions. | Our ten Practice orders on 2 October 2026 won 4; the replay gave 81 signals, 40 won and 41 lost. |
The 5 minute binary signal rule in one line
The rule fits in one line: the side of the EMA 200, the side of 50 on the RSI and an engulfing candle in the same direction, then a five-minute option. Four of our ten Practice orders won, and the replay on recorded candles gave 81 signals, 40 won and 41 lost (49.4% of decided trades, against 54.1% needed to break even at an 85% payout). Both are looks at the past, not forecasts.
If you change the rule, run each change on the Practice balance for a few hundred trades before you compare results, and compare your win rate with the break-even rate for the payout you were given. Our guide to identifying the trend covers other ways to read direction.
Common mistakes
- Reading “5 minute” as the candle size. The chart uses one-minute candles; five minutes is the expiry.
- Entering before the engulfing candle closes. Its colour and size can still change while it forms, and so can the RSI.
- Judging an engulfing candle by its shadows. The rule reads the bodies only, and the previous candle must have the opposite colour.
- Taking an engulfing candle against the filters, for example a bullish one below the EMA 200 or with the RSI below 50.
- Ignoring the payout. In our test the winning orders paid 85% on regular pairs and 82% on OTC pairs, and the break-even win rate rises as the payout falls.
- Treating the option like a margin trade. A binary option has no stop loss and no take profit; it closes at the expiry time.
Related guides
- Bullish engulfing candle and bearish engulfing pattern
- How to trade with the EMA indicator on IQ Option
- RSI indicator trading on IQ Option
- RSI, Stochastic and EMA 200 strategy
- SMA 4 and SMA 30: a 5-minute strategy
- Chart time frames on IQ Option
- IQ Option scripts library, with an RSI, EMA 200 and engulfing script that marks this rule on your chart
- All indicator guides and all strategy guides
Frequently Asked Questions
Q: Which candle size does this strategy use?
A: One-minute candles. The “5 minute” in the name is the expiry of the option, not the candle size, and our Practice test used one-minute candles with a five-minute expiry.
Q: Which indicators does it use?
A: A Moving Average of type EMA with period 200, and the RSI with period 14; the 50 level is on the RSI panel’s scale. The trigger is an engulfing candle, which you read from the candles themselves.
Q: How do I identify a valid engulfing pattern?
A: The body of the signal candle fully covers the body of the previous candle, and the two have opposite colours. A bullish pattern is a green body over a red one; a bearish pattern is a red body over a green one. Shadows are ignored.
Q: How does the strategy identify the trend?
A: By the side of the EMA 200 on which the engulfing candle closes, with the RSI on the same side of 50. On a one-minute chart the EMA 200 covers about three hours and twenty minutes.
Q: What expiry does it use?
A: Five minutes, from the close of the engulfing candle.
Q: How did the rule do in your test?
A: In a Practice test on 2 October 2026, 4 of 10 one-dollar orders won and 6 lost, a net loss of $2.66: 2 of 3 on regular pairs and 2 of 7 on OTC pairs. The replay on recorded candles gave 81 signals: 40 won and 41 lost, a net loss of $7.00 at an 85% payout. Ten orders are too few to say anything about the rule.
Q: Can I adjust the strategy?
A: You can change the rule, but each change makes a new strategy that needs its own test. Keep one rule fixed for a few hundred trades on the Practice balance before you compare it with another.
Q: Is there a script that marks this rule on the chart?
A: Yes. The script library has an RSI, EMA 200 and engulfing script that draws a marker on the signal candle. Import it as shown in our scripts guide.
Q: Can I practise it without real money?
A: Yes. The Practice balance was $10,000 when we looked, and it has a Refill to $10,000 button. See how to register an IQ Option account.

